
The European Association of Geoscientists and Engineers (EAGE) interviewed me. It appears in the 2015 edition of their student newsletter. My fellow students already asked me about it and now you can read it online! I enjoyed talking in the interview with Kirsten Brandt and I do hope more opportunities like this may arise. Interview: Blogging his way […]
Category Archives: Tools
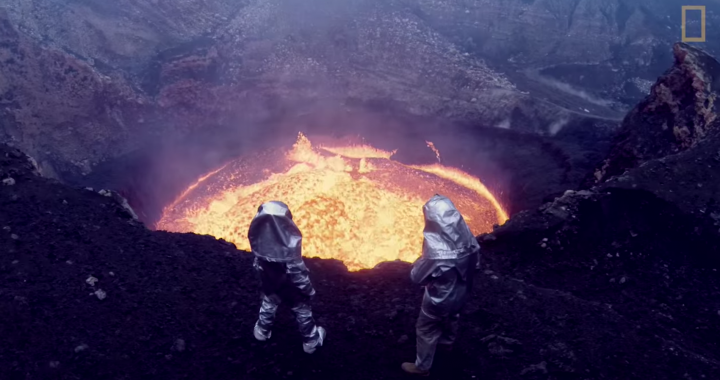
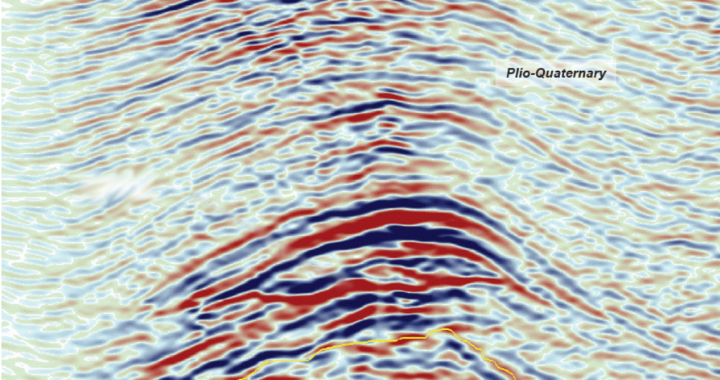
The subjective science of seismic interpretation
The final step in the work with seismic data is seismic interpretation. In a scientific field called geophysics, interpretation sounds highly subjective; Very different from the usual statistics, ray and wave phenomenae. This can’t be right, right? I’d love to say it’s very clear and seismic data reveals a perfect image of the subsurface. But […]

New on StackExchange: Temporal Resolution of Seismic data
Radius of the Fresnel zone is given by [math]Rf=(v/2)(t_0/f_\mathrm{dom})^{1/2}[/math] where v: velocity of layer [math]t_0[/math]: two way travel time [math]f_\mathrm{dom}[/math] :dominant frequency in the spectrum This shows that high frequencies give better resolution than lower frequencies and resolution deteriorates with depth and increasing velocities. However I found some text in “Seismic Data Analysis- Yilmaz” which […]
Do we even need math? – Calculus in geophysics and geology
The amount of calculus in geophysics and geology degrees varies throughout every university and even in uni itself, there seldomly is a consensus on how much math is actually needed. Jascha Polet from Cal Poly Pomona asked a very interesting question on Twitter: Should every student who graduates from a Geology (not Env Sciences) MSc […]

Lifesavers – Two tools in my daily worklife
Today I’d like to share two tools that I have found indespensible in the course of my studies. Ironically, these have nothing to do with geophysics or seismic at all. But they’re out to save you. Git Git is a very low-key version control tool. At certain points in the process of creating you can […]
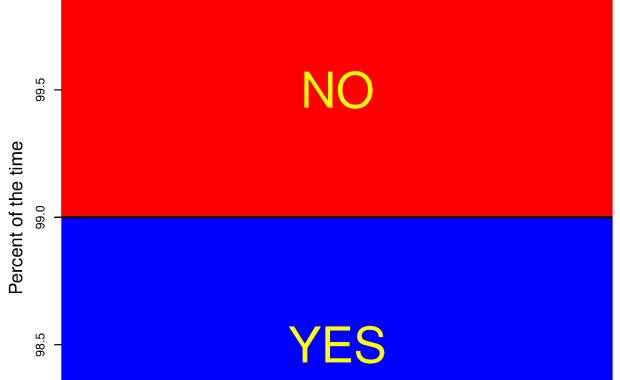
Lying with statistics.
You can see it quite often today, that an essential part of an axis is missing. I usually think highly critical of not showing your entire plot. Finally someone has made the appropriate visualization about lying with statistics. Baseline matters via Flowing Data from Reddit

Promax 2D Multiple Reduction
I am at a point, I could use some help with the program Promax 2D from Landmark Corp. I have posted in a LinkedIn group and this way I hope I may get some signal boost for my question. Do you have some experience with the following? Help a fellow Masters student out? I am […]
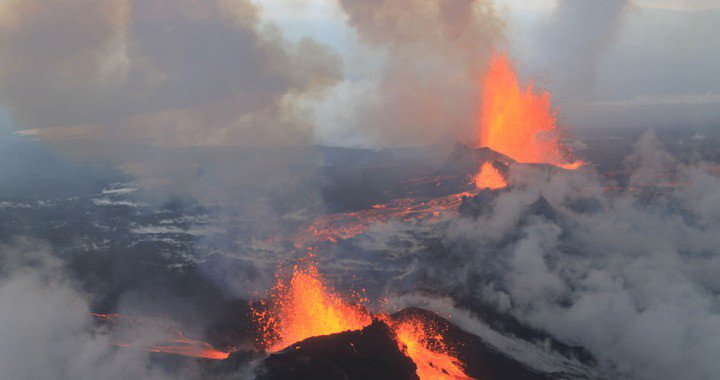
Fly over Bardabunga
[youtube http://www.youtube.com/watch?v=lR6p_zuPx9Q]

Gravity explained – no rubber sheet
I’ve always been suspicious of the rubber sheet explanation for gravity. It was tautological, explaining gravity through gravity. Just didn’t make a lot of sense. Now this explanation actually does: