So you thought there is just one “seismics”?
In general, we might say that the seismics experiment is watching mechanical waves travel through Earth and then apply science on it to get an image of the Earth’s interior. However, this experiment and the science behind it has a high degree of uncertainty. When we conduct this seismic experiment, sometimes we forget that everything scales with the waves we send out. This concept is very important to understand. It’s not very hard but it’s essential to getting your seismics right.
Everything scales to your shortest wavelength
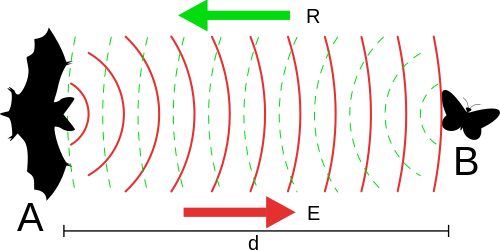
When you take a look at bats, they’re able to send out high-frequency sound waves to find insects, their prey. However, this is sound traveling trough the air. Once we want to send sound waves into the ground, we need lower frequencies. Don’t confuse frequency and amplitude here. The frequency is the pitch of a sound and the amplitude is the volume of the sound.
It does not suffice to get a really loud high-frequency sound, we actually need lower frequencies.
You might be left wondering, why can’t just put a louder sound into the ground, more energy must mean better illumination of the ground, right? Well, remember the little insects a bat hunts at night? Let me just take the freedom and compare the size of a fly or other insect to a small pebble stone. The ground beneath us is full of these pebbles. Basically, every time that high-frequency sound hits such a pebble, the energy of our sound wave will be split into three parts.
- One part gets reflected
- One part travels further down
- The last part “disappears”
Now we know that energy does not just disappear (2nd Law of Thermodynamics anyone?!), however, the energy will dissipate and mechanically heat up that spot where it hit the pebble.
This is just what happens at one pebble stone! Imagine a number of pebbles in the subsurface, this every time the energy of the sound wave will be split into those three parts.
The physical explanation behind this is pretty simple. A frequency is directly coupled to a wavelength by the speed of sound. Once an object is within a quarter of the size of this wavelength, it “can be seen” in our seismic record. The formula is pretty easy as well:
![]() , whereas f is the frequency, c is the speed of sound and that Greek letter called lambda is the wavelength.
, whereas f is the frequency, c is the speed of sound and that Greek letter called lambda is the wavelength.
Deep down below
The seismic experiment is supposed to illuminate several kilometers of the subsurface, so what we do is pick some pretty big wavelength (look at the formula, that equates to pretty low frequencies). When you remember that bat with its high pitch you can barely hear. The upper end of the hearing range is between 15,000 and 20,000 Hertz (Hz), that means you hear up to twenty thousand complete sound waves during one second. Seismics ends on the other end of the audible spectrum. Some new techniques go down to frequencies of two Hertz. This means that you have only two complete waves during one second. This is below the audible spectrum, humans can hear frequencies as low as 12 HzOlson, Harry F. (1967). Music, Physics and Engineering. Dover Publications. p. 249. ISBN 0-486-21769-8 and feel frequencies down to 4 Hz.
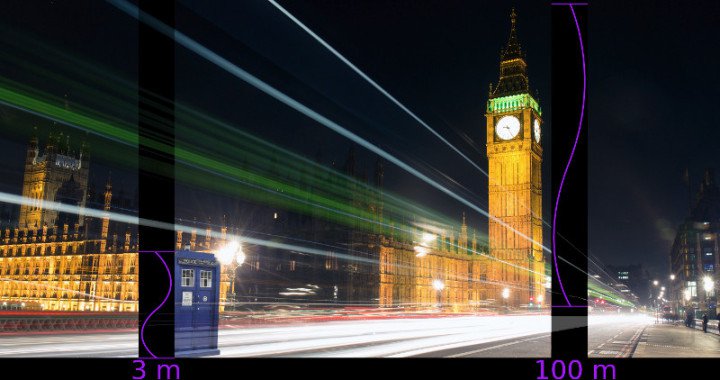
CC-BY-SA Source: TARDIS – CC-BY Big Ben – CC-BY-SA
This oversimplifies seismics a little. We don’t just send one frequency down there. There’s a whole range of frequencies we send down and we record even less of those for other reasons. This range from 10 Hz up to 200 Hz is often used in marine seismics. This converts roughly to a couple meters up to three hundred meters. This basically means we can find things somewhere in the range of this unsuspicious police call box and Big BenIt’s the Elizabeth Tower, inhabiting Big Ben. You know what I mean.. Of course, companies are always pushing on these limits and frequencies can extend down to 2Hz and up to 500 Hz CGG Broadseis. Nevertheless, there’s another application for seismics.
Borehole geophysics
When we drill down into Earth it gets pretty dark and uncomfortable. So information is key. I mean, you wouldn’t want to be the one screwing up an entire drill site because of lack of information, right?
There are many different applications in borehole geophysics, two of these applications lead to a seismic image.
In a borehole, we have very short distances from the sound generator to the receiver. We can do this short distance seismics, but our sound generator has to be in an entirely different frequency range. Sending out a wave that illuminates several kilometers in depth has a wavelength of 100 meters won’t really help in a setting where the receiver is just a couple meters (or less) away from the generator. So we use higher frequencies to get smaller wavelength that travels through the surrounding rock.
The distance between the sender and the receiver is fixed. Think back to high school physics. When we know the distance and measure the time from start to finish, we can calculate the mean velocity. Yes! essentially we’re getting a vertical seismic velocity profile.
When we pair up this measurement with another measurement of the density of the surrounding rock we can calculate a synthetic seismogram. Just that easy.
The Mismatch
However, when we have a look at the initial marine seismic image. Then compare it to our synthetic seismogram, there is a pretty strong mismatch. I have heard quite a few geologists mock the seismic method for this mismatch, stating what kind of science it could be if it isn’t even reproducible.
Now, I don’t want to put geologists down, don’t get me wrong. It’s just not their area of expertise. These images are not supposed to match. If these images matched up perfectly, someone seriously screwed up. Why?
Let’s take a look back at the initial talk about wavelength. Everything in seismics scales to the wavelength.Rafaelsen, B. 2004: Seismic resolution. Short note on seismic resolution and frequency filtering. So when marine seismics uses 100m for a wavelength and borehole geophysicists use a wavelength in the meter range this image has to be different.
Think of it like looking at a fine Monet. From the distance, all these different colored dots merge into one big image, but once you step closer and closer you start to see more and more of the details and the colorful dots.
.JPG)
The seismic wavelength can be seen as a huge smoothing filter. With that 100m wavelength, you see major discontinuities, large reservoirs, and faults. Using a wavelength down to a couple centimeters and all the little details in between these major discontinuities will come into plain sight.
International Ocean Drilling Program

The International Ocean Drilling Program has published a very nice well log that includes a lot of information. Take a quick look at part B and C, they’re seismic velocity and density. D is the synthetic seismogram calculated from this data.
You can find this synthetic seismogram at letter H it was colored according to amplitude and fitted in between a 3D seismic survey. To the left of the synthetic data at letter G you find cross-line seismic data and to the right at letter I, there’s inline seismic data. These are the traces closest to the borehole. Now maybe you have never heard of inline and cross-line, in that case just think of two lines perpendicular to each other. The one in the direction of a ship moving is called inline, the one perpendicular to the movement is called cross-line The synthetic seismogram in this visualization basically serves as a cornerstone of these perpendicular lines.
You can see the mismatch right there. However, you can also see that the synthetic seismogram does not contradict the marine seismic record. There are more fluctuations but especially in the part where surface seismics cannot resolve the subsurface, the synthetic seismogram from the borehole gives a lot of insight.
I know quite a lot of geologists who will cringe at a geo-picture without a proper scale. So just remember that geophysicists don’t use a Nikon lens cap or a quarter Dollar, we use our wavelength as scale.
Know your scale
Jesper Dramsch
Latest posts by Jesper Dramsch (see all)
- Juneteenth 2020 - 2020-06-19
- All About Dashboards – Friday Faves - 2020-05-22
- Keeping Busy – Friday Faves - 2020-04-24
I would like to stress there isn’t really a single wavelength as such but a band of many wavelengths (or frequencies) where each one carries information at an effective scale. Resolution is not just about having small wavelengths, but the broadest band of frequencies as possible.
Also, the mismatch in the synthetic can be caused by several things, sometimes all happening at the same time. The assumption that the borehole measurements are scalable to the seismic method might be invalid, reflection seismology is at least a 2D problem. The chosen wavelet could be wrong, the seismic data could be plagued by reflection patterns not represented by the physical model of the borehole, and so on.
I like this statement,”I have heard quite a few geologists mock the seismic method for this mismatch”, but I am strongly inclined to add that it is not the method that deserves the mocking, it is the neglect of a rigorous treatment of the uncertainty in the modeling process. Failing to express that, as a scientific community, has been a huge disservice, precisely because it is seldom discussed.
Forward modeling is absolutely reproducible, but untreated uncertainty is music to the skeptics ears.
Hi Evan,
Thank you for your reply.
The points you’re making in your comment are very important indeed. There are several reasons for this mismatch, however I always found it interesting that it already starts right at the different acquisition methods.
I think it’s very important to talk about the current limits of seismics. The hackathon you’re organizing is a perfect example for this. Uncertainty isn’t necessarily a bad thing, it basically gives us a frame in which to evaluate the Seismic image. However, all parties involved need to know about it.
Pingback: New on StackExchange: Temporal Resolution of Seismic data - The Way of the Geophysicist